An AI Reviews the Research on AI vs Doctors in Diagnosis
This literature review follows Part 1 of the series about AI vs doctors in medical diagnosis. Beyond this foreword it’s entirely AI-written under my direction. It took a few rounds of feedback to get it into this shape. I read several of the key references in the process of writing Part 3, which sometimes led to more feedback and improvements to this piece. It’s a writing experiment of sorts: Could it be worthwhile to read long-form correspondence between me and AI, if the authors are clearly labeled? I’m curious what you think.
– Keith
Claude Fable 5
From here on, “I” is Claude Fable 5, an AI model from Anthropic.
The evidence rule. I catalogued about 240 sources and read the full text of about 190. A paper is described in detail only if I read the full text; anything known from an abstract alone is listed at the end as further reading, without numbers. Preprints are marked. The last section has more on how this was put together.
Who it is for. People who build or study AI and ML systems, and people who practise medicine. Medical terms are defined where they first appear, and the glossary at the end runs in both directions. The two fields have been describing the same problems in different words for decades; part of the point is to line the words up.
How to read it. It is long, and the sections can be read on their own, so pick the ones you care about. Section 3 is the one the others lean on: it sets out the six-level ladder behind later phrases like “Level 2” and “Level 5.” The argument in brief:
- The AI-versus-doctor comparisons mostly come out “roughly equal,” on weak studies of curated cases, and the score falls as the task gets closer to a real patient (sections 1 and 2).
- Nearly all of them measure diagnostic accuracy, the second of six levels on which a diagnostic technology can be judged, and the few tools tested higher mostly did not deliver (sections 3 and 8).
- The answer keys are expert panels who disagree, billing codes, and machine-extracted labels, and they carry more error than the comparisons admit (sections 4 to 6).
- The same measurement carried two earlier rounds of hype (section 7), and medicine has long-standing instruments for measuring what matters instead (section 9).
- The strongest recent systems answer part of this critique and are still scored on diagnosis (section 10). Section 11 checks three of Part 1’s claims against the literature.
1. The head-to-head studies: “roughly equal,” and weaker than their abstracts
The first big meta-analysis (a study that pools the results of many earlier studies into one estimate) was Liu and colleagues 2019 in The Lancet Digital Health, covering deep learning against health-care professionals in medical imaging. Their search found 82 studies. Only 25 had tested the model on data from outside its training source, and only 14 of those had scored the model and the humans on the same test cases. In those 14, the models and the clinicians were within a point or two of each other on both sensitivity (the share of sick patients correctly flagged, about 87%) and specificity (the share of healthy patients correctly cleared, about 91%). That is the origin of the phrase “equivalent to health-care professionals,” and it rests on 14 studies.
A year later Nagendran and colleagues in the BMJ looked at the same genre from the design side. Of 81 studies comparing deep learning to clinicians, 9 collected their data prospectively (deciding the protocol before seeing the cases, rather than mining an archive) and 6 tested the model in a real clinical setting. The clinicians in the comparison group numbered a median of 4. By PROBAST, a standard checklist for prediction-model studies, 58 of the 81 were at high risk of bias. “Risk of bias” is medicine’s term for design shortcuts that inflate a result without anyone cheating. Part of the checklist is about the test cases (chosen from patients already known to have the disease, or with the hard cases excluded, or labelled by the same people who judged the model); part is about how the model was built and reported (too few cases for the number of predictors, missing data handled badly, no check of whether predicted probabilities match observed rates). An ML reader should not assume a clean train/test split answers it.
And 61 of the 81 abstracts said the AI’s performance was at least comparable to clinicians’. That is the number to hold next to the others: the abstracts were confident in a way the designs were not, and abstracts are where press coverage starts. In a study of 70 clinical-trial press releases, Yavchitz and colleagues 2012 found that overstatement in the abstract was the only thing that predicted overstatement in the press release, which in turn predicted the news story.
The most recent audit of the genre, Chen X and colleagues 2026 in the International Journal of Medical Informatics, asked not who won but whether the contest was fair, across 120 AI-versus-physician studies from 2020 to 2025. 75.8% were retrospective and 62.5% were in radiology. 60.8% used ten or fewer physicians. In 20.8% the AI and the physicians were given different data, in quality or quantity, which the authors say makes “any claim of superiority or inferiority” uninterpretable. In 30.8% the test set’s mix of disease did not resemble a real clinic’s. Half the studies ignored time. And the most common design, radiologists reading images with no access to the patient’s history or prior scans, “systematically underestimates human diagnostic capability and artificially inflates the relative value of narrow AI.” That is Part 1’s point, reached from the other direction: these studies score the doctor on a narrower job than the one doctors do. The paper closes with a checklist for future comparisons, which includes describing how the reference standard was built and how disagreements among the experts who built it were resolved, a point section 4 returns to.
The LLM era has its own meta-analyses, and the answer is the same with a twist. Takita and colleagues 2025 pooled 83 studies of generative AI against physicians into a single accuracy of 52.1%, a number that averages over tasks of very different difficulty and so has no clean referent; the comparisons within it are more useful than the level. Against physicians as a whole there was no significant difference. Split by seniority, using the review’s own crude rule (trainees and residents were “non-experts,” anyone past residency an “expert”), the models were about equal to the trainees and 15.8 percentage points worse than the qualified physicians. Only 20 of the 83 studies were at low risk of bias. So “AI matches doctors” survives, provided the doctors are still in training.
Shan and colleagues 2025, pooling 30 studies, found the best model’s accuracy ranged from 25% to 97.8% depending on the setting, and rated 20 of the 30 studies at high risk of bias, most often for “known case diagnosis”: testing on cases assembled because their diagnosis was already established. That is first a selection problem (a set of confirmed cases does not resemble the stream of patients a clinic sees, so accuracy inflates even for a model that has never seen the case) and, since the cases were published and the models’ training data are undisclosed, possibly a training-data problem as well. How much selection inflates a result was measured long before AI: across 218 evaluations of diagnostic tests, Lijmer and colleagues 1999 found studies that compared confirmed cases against healthy controls overstated a test’s performance about threefold relative to studies on a real clinical stream, and studies that verified different patients with different reference standards overstated it about twofold.
2. From test questions to real patients: the score falls with every step
Exam questions and real cases are different tasks, and the literature now measures the gap directly. Wang and colleagues 2025 ran a network meta-analysis (a method for ranking many contestants that were never all tested head to head; the rankings it produces are its least stable output) over 168 studies: the top model ranked first on exam-style questions, while human experts ranked first at diagnosing actual clinical cases. Same review, same models, opposite winner depending on the task.
The clearest single experiment is CRAFT-MD (Johri and colleagues, Nature Medicine 2025), which replaces the written case with a simulated patient the model must interview. Across 12 specialties, GPT-4’s accuracy on four-option questions fell from 0.820 when handed the vignette to 0.627 when it had to conduct the conversation; with the answer options removed as well, it fell from 0.486 to 0.264. Two drops compound: taking away the multiple choice, and making the model gather the history itself. Applied together, they take the score from 0.820 to 0.264, roughly a third of the exam number. Expert reviewers judged that GPT-4 had collected a complete history in about 71% of conversations and could commit to a single most-likely diagnosis in only about 53%; the paper reports those ratings without the reviewers’ agreement with each other, so they carry less weight than the accuracy numbers. This is Part 1’s complaint from experience, now measured: the model is usually handed a finished case, and the doctor has to build one.
Chen M and colleagues 2026 pooled 50 studies but excluded every multiple-choice format, keeping only studies where the model had to generate a diagnosis. Their result is a ratio of the models’ accuracy to the clinicians’. For the first diagnosis offered the ratio was 0.89, meaning the models were about 11% worse, with a confidence interval that just reaches equal. When the correct answer could appear anywhere in a list of ten, the ratio rose to 1.17, but the interval (0.87 to 1.57) is wide enough that “equal” and “much better” are both consistent with the data. “Top-10 accuracy” is what an ML reader would call recall at 10, and the interpretation is the familiar one: a long enough list makes hits cheap. Chen also pooled the studies where clinicians used an LLM and found the assisted clinicians did better than unassisted ones; section 8 has a randomised trial that found no such benefit.
The hardest corner is rare disease, where accuracy drops furthest: Reese and colleagues found the best LLM ranked the correct rare diagnosis first in 23.6% of cases, against 35.5% for Exomiser, a conventional symptom-matching tool that predates LLMs by a decade. On the ML side, Alaa and colleagues (preprint) make the general version of the point: medical LLM benchmarks are “arbitrarily constructed using medical licensing exam questions,” and rank order on the exam does not reliably predict rank order on patient records.
Has this changed since the era Part 1 describes? The critique has: the evaluation problem is now a published position in both the medical and ML literatures, frameworks like CRAFT-MD exist to address it, and the strongest recent systems (section 10) are built to interview rather than to read. What has not changed is the typical study, which is still retrospective, still scores a fixed input, and still scores it against a label whose provenance sections 4 to 6 take up.
3. The efficacy ladder: accuracy is the second rung of six
In 1991, Fryback and Thornbury proposed six levels at which a diagnostic technology can be judged (the labels are theirs, the parenthetical glosses are mine): technical quality of the test (Level 1); accuracy, sensitivity, and specificity (Level 2: is the answer right?); whether the result changes what the doctor thinks (Level 3); whether it changes what the doctor does (Level 4); whether the patient ends up better off (Level 5); and what it costs society (Level 6). Each rung is necessary for the one above and does not guarantee it. Van Leeuwen and colleagues 2021 restated the ladder for AI products and applied it to 100 commercially available radiology AI tools: 18 had any evidence at Level 3 or higher. Nearly every result in sections 1 and 2 is Level 2.
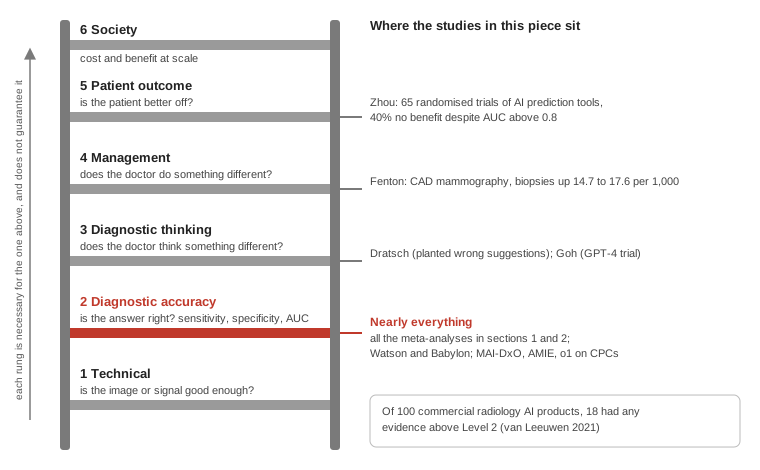
Why a correct diagnosis can fail to help is worth spelling out. The treatment may be the same either way; there may be no treatment; the patient may not be able to get it or take it; or the thing found may never have caused harm, so finding it only adds worry and procedures (medicine calls this overdiagnosis). None of this shows up in an accuracy score. Nor does the shape of the errors: Part 1 points out that a scoring scheme can treat missing the location of a sinus infection the same as confusing a cold with cancer. I found no AI-versus-clinician study that weights diagnostic errors by their clinical cost. The closest instrument medicine has is net benefit (Vickers and Elkin 2006), which scores a decision rule by counting true positives against false positives weighted by how bad each kind of mistake is; it is standard in the prediction-model literature and absent from the comparison genre.
The trial evidence says accuracy and benefit really do come apart. Han and colleagues 2024 found 86 randomised controlled trials of AI in clinical practice, the strongest design medicine has, in which patients or clinicians are randomly assigned to use the tool or not. 70 of the 86 reported a positive result, but the endpoints were “primarily related to diagnostic yield or performance.” Yield means more findings found: in the colonoscopy trials that make up the largest group, more polyps detected per procedure, which is not the same as fewer cancers or fewer deaths. 37 of the 86 trials were in gastroenterology and 24 of those came from four research groups, so much of the trial evidence is one procedure, a few labs, and a stand-in endpoint.
Zhou and colleagues 2021 reviewed 65 randomised trials of AI prediction tools: 26 (40%) found no clinical benefit over standard care, even though the tools had a median AUC of 0.81 in development and 0.83 in external testing. AUC is the probability that the model scores a random sick patient above a random healthy one: 0.5 is a coin flip, 1.0 is perfect, and 0.8 is respectable by the field’s norms. So tools that rank patients respectably well failed, four times in ten, to show a benefit when someone ran the trial. The accompanying editorial (Marwaha and Kvedar 2022) calls it “a humbling reminder that robust predictive utility does not guarantee clinical impact.”
The whole field is shaped around the second rung. Of the 736 unique AI-enabled devices the US FDA had authorised through December 2024, 84.1% detect or measure something rather than treat or plan treatment, and 84.4% work from images; 3 work from electronic health records (Windecker and colleagues 2025). Of 4,609 LLM-in-medicine studies through September 2025, about three a day, 19 were prospective randomised trials (Nature Medicine 2026). The usual explanation, which these counts are consistent with but do not prove, is that images are easy to collect and label, and diagnosis is the rung with a scoreboard.
4. Ground truth (the reference standard): a panel of people who often disagree
Every accuracy above is agreement with a reference standard, and the reference standard is other people. Elmore and colleagues 2015 in JAMA had 115 practising US pathologists interpret breast biopsy slides, 6,900 interpretations in all, and compared each to a three-member expert panel. Overall agreement was 75.3%. It was 96% for invasive cancer and 48% for atypia, the ambiguous middle category, which pathologists over-called 17% of the time and under-called 35%. The three panel members themselves were unanimous on 75% of slides. The case set was deliberately weighted toward the hard categories, so 75% is not the everyday agreement rate in breast pathology; it is the agreement rate on the cases where agreement is hard, which is exactly where an AI-versus-doctor study most needs its answer key to be right. Disagreement is not random noise: it concentrates where the biology is ambiguous. This is a fact about the measurement, not about the pathologists; the tissue genuinely does not sort itself into the categories.
The number both fields use for this, borrowed from psychology, is Cohen’s kappa: agreement beyond what chance alone would produce, where 0 means chance and 1 means perfect. The scale everyone quotes (0.41 to 0.60 “moderate,” 0.61 to 0.80 “substantial”) comes from Landis and Koch 1977, who introduced it with the words “Although these divisions are clearly arbitrary.” McHugh 2012 argues that for clinical data “any kappa below 0.60 indicates inadequate agreement among the raters and little confidence should be placed in the study results.” By that bar, a meta-analysis of 13 psychiatric studies (Rocha Neto and colleagues 2023) puts schizophrenia and bipolar diagnosis below that bar: mean kappa 0.41 between a structured interview and ordinary clinical assessment.
Two cautions an ML reader would apply to inter-annotator agreement apply here too. Kappa depends on how common each category is (Feinstein and Cicchetti 1990 show two ways it can fall while raw agreement stays high), so a low value in a small or lopsided sample means little on its own. And beating a single noisy annotator is easy on aggregate metrics; the claim that matters is beating a carefully built consensus, which is the next paragraph.
The choice of reference standard can move the result by more than the model does. In Google’s diabetic-retinopathy work, Krause and colleagues 2018 compared two kinds of answer key: a majority vote of three board-certified ophthalmologists, and a panel of retinal specialists who discussed each case to consensus (adjudication). Against the adjudicated key, the majority vote of ordinary ophthalmologists caught 83.8% of moderate-or-worse disease and the algorithm caught 97.1%. Switching the labels used to tune the model from majority vote to the adjudicated set moved the model’s AUC from 0.942 to 0.986, a larger gain than most architecture changes deliver. Adjudication is the better key, not a rigged one; the point is that the size of the gap between model and clinician is partly a property of how the answer key was made, and a study that reports the gap without describing the key has left out a variable as large as the one it is reporting.
The remedy is known and expensive, and Krause is an example of it: several independent raters, a protocol for resolving disagreement decided in advance, and the raw disagreements reported alongside the final label. Part 1 describes the other remedy, changing the question until the raters can agree on it, which is what its move from categorical triage labels to preference judgements between pairs of cases did; search-engine relevance judging arrived at the same fix decades ago. Section 6 has an example of it applied to a public dataset, and Chen X’s 2026 checklist asks every future comparison to report it; its routine use in the genre so far is rare.
A field study of five high-accuracy ML diagnostic tools in one hospital’s radiology department (Lebovitz, Levina, and Lifshitz-Assaf 2021) found “none of them met expectations,” and the failures traced to uncertainty the experts managed in daily practice through hedging, further work-up, and deferral, none of which survives conversion into a label.
5. Diagnosis codes are billing records
Much of the non-imaging literature scores models against diagnosis codes, the ICD codes attached to a visit. A code is assigned after the visit, by a coder reading the note or by a clinician at the end of the day, under rules written for reimbursement. O’Malley and colleagues 2005 catalogue how codes go wrong at every step from the patient’s story to the bill, most of it mundane (a vague note, a template that nudges toward a code, a coder working fast) and some of it deliberate, with names: unbundling, upcoding, misspecification. The incentives run in both directions, since payment rules that reward more or more severe codes push one way and coder workload pushes the other. And “the diagnosis” in a record is not one field: the encounter code, the accumulated problem list, and the billed claim are recorded separately and can disagree before any comparison to a reference standard begins.
Three numbers carry the point. Among 2,193 adults carrying a billing code for congenital heart disease, physician review confirmed the diagnosis in 1,069, so the code was right 48.7% of the time (Khan and colleagues 2018). Of 1,453 emergency patients coded for pulmonary embolism (a clot in the lung), 257 did not have one; most of the false positives came from notes saying “rule out PE” being coded as PE (Burles and colleagues 2017). In German insurance data, the national rate of sepsis came out anywhere from 231 to 1,006 cases per 100,000 people per year depending only on which set of codes was counted, a 4.4-fold spread from the same patients (Fleischmann-Struzek and colleagues 2018). Part of that spread is coding convention, and part is that sepsis’s clinical definition is itself contested, a component of genuine clinical disagreement that the cleaner coding examples here don’t have.
Code completeness also drifts with hospital economics: in three chart-reviewed cohorts, the share of true comorbidities that got coded fell for many conditions between 2003 and 2022, which the authors attribute to volume and turnaround pressure on coders (Pan and colleagues 2025). The ML field’s favourite coding benchmark is not exempt: the most common codes in MIMIC-III are under-assigned by up to 35%, and its codes were never independently validated (Searle, Ibrahim, and Dobson 2020).
The reading is short. A model trained to predict codes learns coder behaviour, including the economics. A model that “diagnoses” from the record and is scored against codes is scored against the bill.
6. Imaging data: the model learned the hospital, and the labels came from a machine
Zech and colleagues 2018 trained a pneumonia detector on chest X-rays from two hospital systems and tested it on a third: AUC fell from 0.931 in-house to 0.815 outside. The same models could tell which hospital system an X-ray came from with 99.95% accuracy. The model had learned the hospital, and hospitals differ in which patients get X-rayed with which machines; portable machines are wheeled to the sickest patients. Medicine has two names for the neighbouring problems. Spectrum bias, named by Ransohoff and Feinstein in 1978, is when “the range of features found in patients used to challenge a test,” in their words the pathologic, clinical, and co-morbid mix, does not match the clinic’s; confounding by site, which is what Zech found, is the other. An in-house held-out split is what medicine calls internal validation; external validation means another site, time, or population. ML has an active research area on exactly this under the name distribution shift, but the median medical-AI paper still reports the held-out split and stops.
The labels have the same problem. ChestX-ray14, the dataset behind the first “AI beats radiologists at pneumonia” results, had its labels extracted by an NLP pipeline from radiology reports. Radiologist Lauren Oakden-Rayner looked at the images and wrote, in December 2017, that the dataset “is not fit for training medical AI systems to do diagnostic work,” and of method, “you must (absolutely, definitely, 100% please do it, must) look at the images.” Her peer-reviewed follow-up reviewed about 700 images and found the labels’ positive predictive value (of the images labelled positive, the fraction that really were; an ML reader would call it precision) “mostly between 10% and 30% lower than the values presented in the original documentation.” For collapsed lung, the label was right 90% of the time overall but only 60% once she excluded images showing a chest drain, the tube inserted to treat a collapsed lung. A model trained on those labels learns to find the tube, which means it finds the patients who have already been treated.
Google’s group later did the expensive thing and had three radiologists adjudicate 2,412 ChestX-ray14 images to consensus (Majkowska and colleagues 2020); against that key, the dataset’s original NLP labels had caught only about half the collapsed lungs (sensitivity 49.7%) and half the nodules (45.4%). The imaging field’s own survey (Litjens and colleagues 2017) names annotation, not data, as “the main challenge.” ML has a substantial literature on label noise, test-set errors, and annotator disagreement as signal; what is missing is its use in the papers that compare a model to a clinician, where the label is still treated as the truth rather than as a measurement with its own error.
The deployed version is the Epic Sepsis Model, a proprietary early-warning tool in use at hundreds of US hospitals. Wong and colleagues 2021 tested it at Michigan Medicine on 38,455 hospital stays: AUC 0.63 against the vendor’s reported 0.76 to 0.83; at the threshold the hospital used for paging, it caught 33% of sepsis cases and 12% of its alerts were real. In practice, the tool would have raised an alarm on 18% of all admitted patients, seven of every eight alarms would have been false, two of every three real sepsis cases would have gone unflagged, and in only 7% of sepsis cases would the alarm have arrived before the clinicians had already started antibiotics. Each alarm is a nurse or physician stopping what they are doing to assess a patient; the clinical name for what happens next is alert fatigue, and the tool’s realistic contribution was a handful of catches the team had not already made.
7. Earlier hype cycles: Watson, Babylon, and “stop training radiologists”
Both pre-LLM overhype cases rest on the same measurement as section 1, agreement with clinicians on curated cases, and neither ever measured a patient outcome.
IBM Watson for Oncology. The peer-reviewed evidence consists of retrospective “concordance” studies: a hospital’s historical treatment decision counted as concordant if Watson listed it as either “recommended” or “for consideration.” The best-known result, Somashekhar and colleagues 2018, reported 93% concordance across 638 breast cancer cases in Bengaluru, and the paper documents how the number was reached. First-pass agreement was 73% (463 of 638). The 175 discordant cases were then re-presented to the same tumour board, blinded to Watson’s answer, to see whether its recommendation would change “in light of new medical advances and guidelines”; the board changed its own prior decision in 128 of them, lifting concordance to 93%. The 463 concordant cases were not re-reviewed. Some of those reversals are medicine changing over the intervening years, which is a board doing its job; but a re-review that could only raise the score is not a measurement of Watson. Elsewhere the agreement collapsed where local practice differed from the US training data (11.9% for gastric cancer in Qingdao, Zhou and colleagues 2019), and a meta-analysis of nine studies (Jie and colleagues 2021) found no patient outcome measured in any of them. As Tupasela and Di Nucci 2020 put it, concordance shows “only that the two forms of expertise agree.” IBM sold the Watson Health assets in 2022.
Babylon Health. The claim that Babylon’s AI was “on par with” GPs (general practitioners, the UK’s primary-care doctors) rests on one company-authored study (Razzaki and colleagues 2018, preprint; peer-reviewed as Baker and colleagues 2020 with the same numbers). One hundred case vignettes were written by doctors and role-played by GPs hired for the study, some of them Babylon employees; seven doctors each saw between 47 and 78 vignettes, the AI saw all 100. On the intended diagnoses the AI and the doctors were within a few points of each other. “Safe” triage was 97.0% for the AI and 93.1% for the doctors, where safety was judged by a single independent reviewer and explicitly counted an overly cautious recommendation as safe, so a system that sent everyone to the emergency department would have scored 100%. Fraser, Coiera, and Wong in The Lancet wrote that the study “does not offer convincing evidence” the system could outperform doctors “in any realistic situation,” noting that no significance testing was done and that the comparison hinged on one doctor’s poor performance. Babylon’s most rigorous paper, Richens, Lee, and Johri 2020 in Nature Communications, beat 44 doctors on 1,671 vignettes and is still a vignette study. The company collapsed in 2023.
The 2016 prediction that dates this era, Geoffrey Hinton’s “people should stop training radiologists now,” belongs with these two: US radiology residency positions grew 33% between 2010 and 2025, and practising radiologists 12% between 2010 and 2022, from 11.1 to 11.5 per 100,000 people (Malhotra and colleagues 2026), with applications to the specialty still rising (Futela and colleagues 2026).
8. In deployment: the benchmark score is not what patients, clinicians, or clinics get
Patients. The one randomised trial of people actually using an LLM for a health decision is Bean and colleagues 2025 (preprint, 1,298 UK participants). Handed the scenario directly, the models identified the relevant condition 94.9% of the time; participants using those same models identified it at most 34.5% of the time, worse than the 47.0% of a control group using whatever they normally used. System performance and user performance are different quantities, and here the gap reversed the sign. Behind that sits the question of whether patients can tell a good answer from a bad one. In Armbruster and colleagues 2024, specialists rated GPT-4’s answers to 100 real patient questions, and for 15 of them one of the three specialists in the relevant field flagged the answer as potentially harmful; the 64 patients rating the same answers did not rate those 15 any lower. It is one study of 64 people, and its direction is the worrying one: a harmful answer read as well as a good one.
The widely quoted empathy result, Ayers and colleagues 2023, is weaker than its reputation: clinicians reading transcripts called 45.1% of the chatbot’s answers empathetic against 4.6% of physicians’, but the physicians were unpaid volunteers writing a quarter as many words, and empathy scored by a reader of a transcript is not empathy experienced by a patient. Every number in this section is about a diagnosis or a rating extracted from generated text; the correctness of the prose itself, which is what the patient actually reads, is the thing Armbruster is measuring and almost nobody else is.
Clinicians. The canonical deployed case predates deep learning and was measured at Level 5 of section 3’s efficacy ladder, effects on patients. Computer-aided detection (CAD) for screening mammography marks suspicious spots for the radiologist. Fenton and colleagues 2007 in the New England Journal of Medicine studied 429,345 mammograms at 43 facilities, 7 of which installed CAD during the study. At those seven, cancers detected per 1,000 mammograms did not change (4.15 before, 4.20 after). Biopsies per 1,000 mammograms rose from 14.7 to 17.6, and the fraction of women called back who turned out to have cancer fell from 4.1% to 3.2%. In plain terms: for every thousand women screened, CAD sent about three more for a biopsy, a needle or surgical sampling of the breast with days of waiting for the result and a bill attached, and found no additional cancers for it. Detection is itself a stand-in (the outcome screening exists for is fewer breast-cancer deaths, which this study does not measure), but the extra biopsies are a Level 5 harm on their own. A later study of 625,625 digital mammograms (Lehman and colleagues 2015) found no metric improved with CAD, and among the radiologists who read mammograms both ways, sensitivity was significantly lower with CAD than without it. CAD was cleared by regulators and reimbursed for two decades on the strength of its detection performance, the second rung.
The deep-learning version is a Level 3 result, does the suggestion change what the doctor thinks, and it was measured in the laboratory. Dratsch and colleagues 2023 gave 27 radiologists 50 mammograms with a purported AI’s suggested ratings, 12 of them deliberately wrong. With a wrong suggestion in front of them, the inexperienced radiologists’ rate of correct ratings fell from 79.7% to 19.8%, and the most experienced from 82.3% to 45.5%. Working radiologists would object, fairly, that the experiment removes the checks they would normally run; the result shows the pull of a suggestion, not the rate at which clinics are fooled.
The LLM-era randomised trial is Goh and colleagues 2024: 50 physicians, six real-patient cases, GPT-4 available or not, scored on a structured rubric for diagnostic reasoning (the differential offered, the evidence cited for and against it, and the next steps). Physicians with GPT-4 scored 76% and physicians without it 74%, a difference of 2 points with a confidence interval from −4 to +8, which is to say no detectable effect; GPT-4 run on its own scored 92%. The 92% is the number that travels, and the trial’s finding is that the physicians who had it available did not reach it. The authors conclude that “access alone to LLMs will not improve overall physician diagnostic reasoning.”
That points the other way from Chen M 2026’s pooled finding in section 2, though the conflict is softer than it looks: Chen pooled diagnostic accuracy and did not include this trial, which scored reasoning instead. The question is not settled. What a meta-analysis of 106 human-AI experiments across fields (Vaccaro, Almaatouq, and Malone 2024) adds is that the combination performs worse, on average, than the better of the two alone (though still usually an improvement over the human alone), and worst of all when the AI alone was the stronger party. “AI beats doctors” does not imply “doctors with AI beat either.”
The clinic. Google Health’s own deployment study, Beede and colleagues 2020, followed a diabetic-retinopathy screening model into 11 Thai clinics. Of 1,838 eye images taken in the first six months, 393 (21%) were rejected by the system as too poor to grade, for reasons like rooms that could not be darkened and cameras needing repair; nurses spent 2 to 4 minutes per patient retrying photographs with queues of up to 150 people. Under the protocol, a patient whose image could not be graded was referred to a specialist, the visit the screening existed to make unnecessary. Coiera 2019 calls this “the last mile,” where “technically high-performing systems perform poorly,” and recommends developing and testing AI “within the context in which it finally will be used.”
9. Measuring what matters: surrogate endpoints, outcome questionnaires, and medicine’s own goals
The trap has a name. Medicine’s term for a number that stands in for the outcome is the surrogate endpoint, and Fleming and DeMets 1996 wrote the standard warning: “A correlate does not a surrogate make.” Their central example is the CAST trial. Two drugs suppressed the abnormal heart rhythms that everyone treated as the target; among 730 patients on the drugs and 725 on placebo (CAST Investigators 1989), 63 and 26 had died by the final tally Fleming and DeMets report. The drugs fixed the number on the monitor and killed more people. Diagnostic yield in section 3 and cancer-detection rate in section 8 are surrogates in this sense: plausible stand-ins for the outcome that may not carry through to it.
“Treatment accuracy” is not even a surrogate; it is agreement. The metric the ML literature reaches for when it moves past diagnosis is agreement with what the physician prescribed. In a survey of 37 deep-learning medication-recommendation models (Ali and colleagues 2022), the dominant metrics were F-score (a balance of precision and recall) and Jaccard overlap (the share of drugs the model and the physician both chose, out of all the drugs either chose), both scored against the physician’s actual prescription. This is the Watson design again, and it fails differently from a surrogate: it cannot score higher than current practice, and it inherits every error current practice makes. CAST’s drugs were standard practice when the trial began; a model scored on agreement with the prescribers of 1988 would have recommended them.
The instruments exist. What a Level 5 outcome looks like as data is mostly a validated questionnaire. The PHQ-9, the standard depression screen, is nine questions about the past two weeks, scored 0 to 27; its authors propose a score below 10 and a 50% drop from the starting score as the threshold for clinically significant improvement. The CDC’s Healthy Days module is four questions, including how many of the last 30 days were physically or mentally unhealthy. The difficulty is not scarcity but abundance and incompatibility: thousands of such instruments exist, and Kaplan and Hays 2022 write that the plethora “has impeded cumulative science because incomparable measures have been used.”
Measuring is an intervention, and metrics get gamed. A meta-analysis of 45 randomised trials found that routinely collecting patient-reported outcomes in cancer care, with a pathway for acting on them, was associated with better quality of life and a 16% relative reduction in mortality (Balitsky and colleagues 2024). The mortality figure rests on only the 3 trials (1,289 patients) that reported it, and the authors rate it moderate certainty because of possible reporting bias; the effect belongs to measuring-plus-responding, not to the questionnaire. And once a number carries a penalty it changes: after Medicare began penalising hospitals for readmissions, readmissions fell, and one analysis (Wadhera and colleagues 2018) found the programme associated with more deaths among heart-failure and pneumonia patients. Whether the policy cost lives is argued over; that the target number improved without the patients demonstrably improving is the part that matters here.
Optimising treatment directly runs into the missing counterfactual. The flagship attempt, the “AI Clinician” (Komorowski and colleagues 2018, Nature Medicine), learned a policy for sepsis treatment from ICU records and reported that “mortality was lowest in patients for whom clinicians’ actual doses matched the AI decisions”; Jeter and colleagues 2019 (preprint) argue the apparent superiority depends on the paper’s modelling choices. The outcome of the treatment not given is never observed, so the choice of evaluation method becomes the result.
The goals. What medicine has written down for itself is the Triple Aim (Berwick, Nolan, and Whittington 2008): better experience of care, better population health, lower per-capita cost, pursued simultaneously. Bodenheimer and Sinsky 2014 add a fourth, the work life of clinicians and staff, on the argument that burnout undermines the other three. Diagnostic accuracy is on neither list; it is upstream of all four, and the distance is what the ladder measures.
Part 1 asked for the fourth aim in particular, minutes saved and job satisfaction, and the answer splits by what the AI does. For documentation tools, the ambient scribes Part 1’s conclusion cites, the evidence is real, modest, and product-dependent. The largest study (Rotenstein and colleagues 2026, JAMA, 8,581 clinicians at five academic medical centres, adopters against non-adopters) found 13 fewer minutes in the record and 16 fewer minutes documenting per eight hours of scheduled patient care, half a visit more per week, and no significant change in after-hours documentation, the number most tied to burnout. The one randomised trial (Lukac and colleagues 2025, NEJM AI, 238 UCLA physicians, two products) found one product cut time in notes by 9.5% and the other not at all, while both improved self-reported burnout scores. The 51.9% to 38.8% burnout drop that circulates (Olson and colleagues 2025, 263 clinicians, six systems) comes from a 30-day before-and-after study with no control group and a vendor employee among the authors. For diagnostic AI the fourth-aim evidence is nearly empty, and what exists points the other way: across 185,044 chest CT reports at two Chinese hospitals, a lung-nodule detector made report drafting 0.86 minutes slower per report on average (Liu and colleagues 2026), with the two hospitals moving in opposite directions. Goh’s trial has the one diagnostic-AI clinician-time number, 519 against 565 seconds per case, as a secondary outcome. So the tools with clinician-time evidence are the ones that do not diagnose, which is Part 1’s argument about where the effort should go, made by the shape of the literature.
10. The strongest case for AI: MAI-DxO, AMIE, and o1 on NEJM cases
The best recent work is designed to answer section 2’s critique, that the model is handed a finished case instead of having to interview the patient. It deserves to be read at full strength, with the same questions asked of it.
MAI-DxO (Nori and colleagues 2025, Microsoft AI, preprint) converts 304 New England Journal of Medicine clinicopathological conference cases into sequential encounters. CPCs are published teaching cases, chosen after the fact because they are instructive and because they resolved to a definite answer, which means the answer key is clean in a way a clinic’s never is. The system must ask questions and order tests, each with a price, before committing. Its cost-balanced configuration reached 80% diagnostic accuracy; its maximum-accuracy configuration reached 85.5% at an estimated $7,184 per case, against 21 practising physicians (median 12 years’ experience) at 19.9% and $2,963, working “without access to colleagues or textbooks, or even off-the-shelf LMs.”
Two design facts belong next to those numbers. “Accuracy” here is not exact match: a “Judge” agent, an o3 model with a physician-written rubric, scored each free-text diagnosis against the published answer on a five-point scale covering the core disease, its cause, the anatomic site, qualifiers, and completeness, and a case counted as correct at 4 or above, which the authors gloss as a diagnosis that would lead to appropriate treatment. That is finer-grained than exact match, but it is not the cost-weighted scoring section 3 asks for: the rubric grades specificity and completeness rather than the clinical cost of an error, and the five-point grade is then collapsed to pass/fail before the headline number is computed. The judge was checked against in-house physicians on 56 diagnoses, and the same judge scored the physicians. And the dollar figures are modelled, not observed: a fixed $300 per physician visit plus test prices estimated by a language model, which the authors say “are not intended to be exact representations of actual clinical expenses.”
The authors’ own caveat: “further testing is needed to assess its performance on more common, everyday presentations.” What it establishes is that the interviewing critique can be engineered around and scored. What it leaves open is whether puzzle cases resemble a clinic’s case mix, whether a physician denied colleagues and references is the right baseline, and which rung a correct puzzle answer sits on.
AMIE (Tu and colleagues 2025, Google DeepMind, Nature) is a randomised, double-blind crossover study with 159 scenarios and patient-actors, in which the conversational system was rated better than 20 primary-care physicians on 30 of 32 axes by specialist physicians (three per scenario, with inter-rater reliability reported) and 25 of 26 by the actors, including empathy. It is the most rigorous peer-reviewed “AI beats doctors” result to date. It is also a rating study: the axes are subjective scales, and a better-rated transcript is not better care. Its stated limitation is that the physicians worked through a text chat, “unfamiliar in clinical practice.”
Reasoning on CPCs (Brodeur and colleagues 2026, Science; numbers below are from the preprint, which the published abstract matches). OpenAI’s o1-preview included the correct diagnosis somewhere in its differential in 78.3% of 143 NEJM cases and put it first in 52%; the length of the list was whatever the model chose to write. The authors write that the classic challenge “of reasoning over complex clinical case vignettes has now been consistently met,” and add: “We must now focus on human-computer interaction studies and prospective clinical trials.” The Goh trial in section 8 is that group’s first step, and its 92% for GPT-4 alone is not a small number. And the clinician-plus-AI question is genuinely open: Goh’s trial and Vaccaro’s cross-field meta-analysis (section 8) found the combination no better or worse than the best party alone, but Chen M 2026’s pooling of the medical studies found assisted clinicians did outperform unassisted ones. The case for the other side is real.
What the strongest case shares with the weakest is the rung. Each of these systems is scored on diagnosis, against a reference standard, on a curated or simulated case, and none has a result at Level 5, effects on patients. The capability gains are real, the interviewing critique is being engineered around, and the question of whether patients do better has not yet been asked of any of them.
11. Fact-checking three claims from Part 1
Part 1 makes three claims from memory that the original search did not cover. I went looking after Keith’s revision.
Many primary-care visits are not about a fresh diagnosis. The CDC’s National Ambulatory Medical Care Survey (2019 tables) codes the main reason for each of about 1.04 billion US office visits: 26.5% were a new problem; 36.8% routine care of a chronic problem, 7.1% a flare-up of one, 21.6% preventive care, 6.4% before or after surgery. That is all office specialties together (the tables do not split reason by specialty), but for primary care specifically 87.5% of visits were with an established patient, and across all visits 82.3% of the medications mentioned were continuations rather than new prescriptions. A family-medicine study (Beasley and colleagues 2004, 29 physicians, 572 encounters) adds that a visit is not one problem: physicians handled a mean of 3.05 problems per encounter, charted 2.82, and billed 1.97, so the bill undercounts the visit by a third. In an Israeli HMO (Golan Cohen and colleagues 2025), visits carrying no diagnosis at all rose from 24% to 30% of the total between 2019 and 2023. Part 1’s claim holds, with the caveat that “new problem” and “routine follow-up” often share one visit.
The answer is often already in the record. I found no direct study of clinicians writing notes for liability, but the consequence Part 1 describes is well documented: the record encodes what the clinician already concluded, so a model scored on it is scored partly on the conclusion. Ramadan and colleagues 2025 reviewed 92 studies predicting in-hospital outcomes from the MIMIC database and found 40.2% had used the patient’s discharge diagnosis codes, assigned after the outcome, as input features; codes alone predicted in-hospital death with an AUC of 0.97, led by “brain death” and “encounter for palliative care.” Agniel, Kohane, and Weber 2018 showed how general the mechanism is: for 233 of 272 laboratory tests, whether the test had been ordered predicted three-year survival regardless of its result.
The interface shapes the codes. I found no study of diagnosis-code autocomplete specifically, but the defaults literature leaves little doubt about the direction. Switching a health system’s prescription default from brand to generic took generic prescribing from 75% to 98%, and it was still 98.4% thirty months later (Olshan, Rareshide, and Patel 2018; the original 2014 study is in further reading). Lowering a surgical default from 30 opioid pills to 12 cut the share of 30-pill prescriptions from 39.7% to 12.9% (Chiu and colleagues 2018); adding a 10-tablet default in an emergency department moved prescriptions at exactly 10 from 20.6% to 43.3% of the total (Delgado and colleagues 2018). Whatever a pick-list puts first becomes the modal answer. There is no reason diagnosis codes would behave differently, and Part 1 reports that they did not.
That is where the literature stands. In Part 3, Keith will respond with what he saw building ML tools for a primary-care clinic, take a closer look at the section 10 studies, and push back on a few points made here.
Glossary: the same ideas in both vocabularies
Some rows are two words for one thing, some are one word the fields share, and some only overlap. The last column says which.
| Machine learning says | Medicine says | The difference that matters |
|---|---|---|
| Label, ground truth, gold standard | Reference standard, gold standard | Medicine treats it as a measurement with its own error; the comparison genre mostly doesn’t (section 4) |
| Inter-annotator agreement, kappa | Inter-rater reliability, kappa | Same statistic in both fields: agreement corrected for chance, which depends on how common each category is. McHugh’s bar for clinical data is 0.6; below it, distrust the study (section 4). Cohen’s kappa is for two raters; for more raters or missing ratings, look up Fleiss’ kappa and Krippendorff’s alpha, the latter more common in recent NLP work |
| AUC, AUROC | AUC, c-statistic | Same quantity: the probability that the model scores a random sick patient above a random healthy one. 0.5 is a coin flip, 1.0 is perfect (section 3) |
| Calibration | Calibration | Same word, same meaning: do predicted probabilities match observed rates. Many ML systems act only on a decision threshold and never show anyone the probability, so the check is often skipped; medicine’s risk scores and decision tools (net benefit, decision curves) use the probability itself and mislead without it |
| Precision | Positive predictive value (PPV) | Same quantity. Of the cases flagged, the share that are real. Unlike the next two rows, it changes with how common the disease is |
| Recall, true positive rate | Sensitivity | Same quantity. Of the real cases, the share flagged |
| True negative rate | Specificity | Same quantity. Of the healthy, the share correctly cleared. ML papers usually report precision and recall instead. Sensitivity and specificity each look at one class, so they do not move with how common the disease is; precision (PPV) does. In radiologist Lauren Oakden-Rayner’s worked example, a test with 90% sensitivity and 90% specificity has 8.3% precision when 1% of patients have the disease and 90% when half do, which is why she asks for both kinds of metric, with precision reported at the clinic’s real prevalence |
| Recall at k, hit rate | Top-k accuracy | A long enough list makes hits cheap (section 2) |
| Evaluation on a held-out test split | Internal validation | Same site, same time, same population as training |
| Distribution shift; out-of-distribution or out-of-domain data | External validation | Testing on another site, time, or population, which is where the shift shows up (section 6) |
| Dataset bias, selection bias | Spectrum bias; risk of bias in patient selection; “known case” designs | Same problem in both fields: how the test cases were chosen inflates accuracy, with no leakage involved. Test-set contamination, the model having seen the cases in training, is a separate problem (sections 1 and 6) |
| Spurious correlation, target leakage; “shortcut learning” in some recent papers | Confounding by site; hidden stratification | The model keys on something that travels with the label rather than the disease: the hospital, the chest drain, a discharge code assigned after the outcome (sections 6 and 11) |
| Offline evaluation vs A/B test | Retrospective study vs prospective study; randomised controlled trial (RCT) | An RCT randomly assigns who gets the tool; it is the only design that shows benefit rather than accuracy. On the six-level ladder, accuracy on a test set is Level 2 and benefit to patients is Level 5 (section 3) |
| Cost-sensitive loss, weighted error | Net benefit, decision-curve analysis | Both weight false positives against false negatives by their consequences; medicine’s version is standard in prediction-model papers and absent from the comparison genre (section 3) |
| Proxy metric | Surrogate endpoint | A number that stands in for the outcome. A well-chosen one carries through to it. When one is optimised and does not, the tech industry calls it Goodhart’s law and reinforcement learning calls it reward hacking; CAST is medicine’s canonical case (section 9) |
| OKRs, KPIs, top-level business metrics (tech-industry terms, and a loose fit) | Triple Aim, Quadruple Aim | The aims are organisation-level goals, not a model’s objective function and not a single number. Anything a model optimises is a proxy for them, and diagnostic accuracy is upstream of all four (section 9) |
Further reading
Sources I know only from abstracts; no number above rests on them.
Comparisons and evaluation
- Park and Han 2018, Radiology: methodologic guide to evaluating AI for diagnosis and prediction.
- Rajkomar, Dean, and Kohane 2019, NEJM: “Machine learning in medicine,” the bridge in the other direction.
- Wiens and colleagues 2019, Nat Med: “Do no harm,” a roadmap for responsible ML in health care.
- Kelly and colleagues 2019, BMC Med: key challenges for delivering clinical impact with AI, from inside Google Health and DeepMind.
Study design and statistics
- Bossuyt and colleagues 2015, BMJ: STARD 2015, the reporting standard for diagnostic accuracy studies.
- Wolff and colleagues 2019, Ann Intern Med: PROBAST, the risk-of-bias checklist used in section 1.
- Steyerberg and Vergouwe 2014, Eur Heart J: the “ABCD” of validating a prediction model, including calibration and net benefit.
- Sounderajah and colleagues 2021, Nat Med: QUADAS-AI, the risk-of-bias tool adapted for AI studies.
Labels and rater agreement
- Schaekermann and colleagues 2019, CSCW: structured adjudication with 36 medical experts over 4,543 cases.
- Oakden-Rayner and colleagues 2020, CHIL: hidden stratification, the peer-reviewed generalisation of the chest-drain problem.
Deployment
- Lyell and Coiera 2017, JAMIA: review of 40 automation-bias studies back to 1983.
- Patel and colleagues 2014, Ann Intern Med: the original opt-out generic-prescribing default study, 75% to 98%.
- Budzyń and colleagues 2025, Lancet Gastroenterol Hepatol, and Pedersen and colleagues 2025, Endoscopy: the two studies on whether AI-assisted colonoscopy deskills endoscopists, one positive and one null.
- Ross and Swetlitz 2017, STAT, and Strickland 2019, IEEE Spectrum: the investigative reporting on Watson for Oncology.
Essays by people with standing
- Eric Topol, “The paradox of medical AI implementation,” Ground Truths, May 2026.
- Deena Mousa, “The algorithm will see you now,” Works in Progress, September 2025: the radiology-workforce retrospective.
- Lee, Goldberg, and Kohane 2023, The AI Revolution in Medicine.
How this was made
For readers who want to know what “AI-written” meant here, or who want to try something similar.
- Models. The research, drafting, and revisions were done by Claude Fable 5, from the top tier of Anthropic’s generally available models at the time, between August and September 2026. Smaller Claude models, mostly Sonnet, did the mechanical work: retrieving papers and checking each number in the draft against the paper it came from. A final pass on navigation and the glossary used Fable 5.1.
- Sources. A first sweep in five directions worked mostly from abstracts, and was treated as a list of leads rather than a draft. The full-text reading came after that. Keith retrieved 14 papers that were paywalled or blocked to automated access. Each source has a registry entry recording what was read and which claims were checked against it.
- Review. Keith set the evidence rules, gave a few rounds of feedback on drafts, and read key papers himself while writing Part 3. The draft also went through two rounds of simulated reader review: eight simulated readers with different backgrounds, from students to clinicians and ML researchers, run on a mix of Claude models (Fable, Opus, Sonnet, and Haiku). Keith and I went through their reactions together, and several corrections in this part came from those rounds.
- What it was not. One prompt to one model. The work ran for about a month, and more of the effort went into verification than into writing.
Thanks
Big thanks to Mandy for reviewing!
– Keith