Employee retention in Python
This post shows the math of employee retention, including sample code in Python that you can use for your own team.
I looked into this because my team had more attrition than expected a year or two ago. At the time, I couldn’t find the kind of article I needed, so now that I have some time I’m writing up what I found for you and others. (And for the record, I also did exit interviews and looked for themes)
Making a math problem
Let’s formulate the problem first:
What percent of employees stay with the company until their 1st anniversary? 2nd anniversary? 3rd anniversary?
I didn’t initially understand why it was better than any sort of simple average. I’ll explain by critiquing simpler alternatives:
Alternative 1: Average tenure of current employees
You could check how long each employee has been with the company and just average.
If your team is growing quickly, most of your employees are new, which unfortunately brings down the average. That doesn’t sound right – hiring new people shouldn’t make your retention number immediately worse!
On the other hand, if you’ve lost a lot of employees, those employees don’t affect the number at all! In the worst case you could have most employees quit immediately but a few employees stick it out for a long time and the average would be high. That would also be misleading.
Alternative 2: Average tenure of all former employees
You could look over everyone that’s left and average how long they stayed.
Unlike the previous alternative, in this case if people quit right away the average would be appropriately low.
It doesn’t take current employees into account though, so it could misrepresent the situation. In the extreme, it doesn’t even have a defined value until people start leaving. People leaving can happen for all kinds of reasons, so you wouldn’t want to only take that group into account.
For a large enough team, this might be a reasonable approach. But on a small team you need to find a way to use the data for both employees that left and employees that are still with the company.
Survival analysis: the Kaplan-Meier estimator
A better approach is to use a Kaplan-Meier estimator, which uses data from both current and former employees to estimate how long people stay. The lifelines module provides an implementation in Python. Here’s an example with just three employees:
import pandas as pd
team_df = pd.DataFrame([
    {"name": "Bart", "start_date": "2010-01-07", "end_date": "2015-05-03"},
    {"name": "Lisa", "start_date": "2012-06-10", "end_date": None},
    {"name": "Maggie", "start_date": "2016-03-24", "end_date": None}
])

# convert to datetimes to make it easier to calculate duration
team_df["start_date"] = pd.to_datetime(team_df["start_date"])
team_df["end_date"] = pd.to_datetime(team_df["end_date"])

team_df["duration_years"] = (team_df.end_date.fillna(datetime.today()) - team_df.start_date) / timedelta(days=365)

team_df["left_company"] = team_df.end_date.notnull()


# Kaplan-Meier is the classic way of estimating survival
# In the graph, at 3 years of tenure it's showing the fraction of employees that started over 3 years ago that are still employed here
from lifelines import KaplanMeierFitter
estimator = KaplanMeierFitter()
estimator.fit(team_df.duration_years, event_observed=team_df.left_company)

ax = estimator.plot_survival_function()
ax.set(xlabel="Years of tenure", ylabel="Fraction of employees retained")
The graph isn’t that interesting with only three:
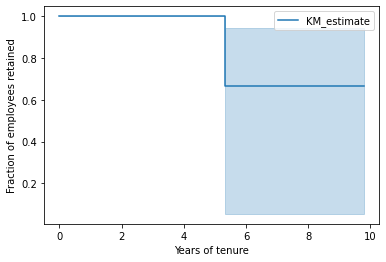
The reason there’s a drop around 5.5 years is because Bart left after 5.5 years. Maggie has stayed with us for about 6 years already, but for all we know she may stay for 10 years or longer. Likewise Lisa’s been with the team for almost 10 years and we just don’t have data to say how much longer we expect her to stay.
Small teams are hard to analyze, so I generated a synthetic team that’s had 100 employees over the years. I generated start dates from a uniform distribution in the time range, and generated the duration of employment using a log-normal distribution. This is what the retention graph looks like:
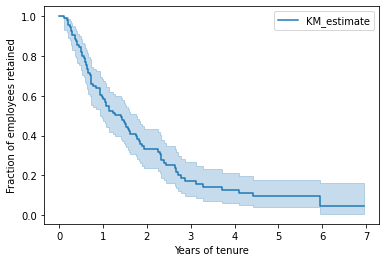
The x-axis shows the time since an employee’s start date and the y-axis shows what percent of employees make it that far. About 60% of employees made it to their 1st anniversary. In other words, 40% quit in their first year in this fake team. About 30% of employees in this example made it to their second anniversary.
Tips
- There may be many kinds of unusual circumstances, ranging from firing to leaving for health reasons to changing teams. If you have a big team it probably won’t change the numbers much but in a small team you may need to filter out some employees.
- If you want a single number (the median), it’s
estimator.median_survival_time_
Once you have statistics like median tenure, you can compare against other teams at the same company or search for published stats from similar companies.
Diving deeper with Cox proportional hazards
It’s not always enough to know the median duration on a team, we really need to figure out what’s leading to attrition. The Cox proportional-hazards model is one tool that can help us.
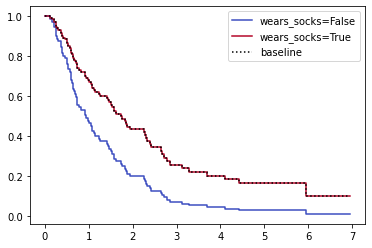
In this example team, I also randomly generated an employee feature “wears_socks” and made it so that wearing socks led to 50% longer duration with the company. I’m using a silly example like wearing socks but the same approach will work for more serious investigations into gender, race, etc.
The Cox model correctly discovers that wearing socks affects retention with p<0.005. You can also see the effect in the graph:
from lifelines import CoxPHFitter

cph = CoxPHFitter()

# Notes on data prep:
# It can handle ints/floats but not any kind of categorical value or string
# It crashes if the features are too correlated
# CoxPHFitter uses all columns in the dataframe, so drop unneeded ones
prepped = team_df.drop(["name", "start_date", "end_date"], axis=1)

cph.fit(prepped, duration_col="duration_years", event_col="left_company")

# plot the effect of wears_socks on retention
cph.plot_partial_effects_on_outcome(covariates="wears_socks", values=[False, True], cmap="coolwarm")

# check all results, including confidence intervals per coefficient and significance tests
cph.print_summary()
You can use this model with many employee features at the same time and check the confidence intervals and p-values.
Keep in mind that the model doesn’t explain why wearing socks affected retention for this hypothetical team. It could be that only high-paid employees wear socks, or it could be that the office is cold and barefoot employees leave in frustration. You still have to think carefully about what might affect retention and why. I recommend using it as a tool to check your intuitions about what’s leading to attrition.
Also keep in mind that the model assumes that each feature affects retention independently and may not handle intersectionality well.
If you’re interested in diving deeper with more realistic data, IBM released an example data set with many different employee features you can try out – see this notebook for an example.
Tip: You can do a basic cohort analysis by bucketing the start_date with pandas.qcut.
What it meant for my team
When I was dealing with retention issues a year or two ago, I was worried that immigration status may play a significant factor in retention.
What I actually found was that software engineers on my team left much sooner than machine learning engineers, and no other variable explained the data nearly as well. Keep in mind that it doesn’t say why retention was different between groups – it could be that I was better at managing machine learning engineers than software engineers, or that the MLE roles were more fun, or it could be that software engineers had more job prospects, or any number of factors. I didn’t have the data to compare against other teams, which might have provided more insight.
In the end, I resolved to put more effort into retention for software engineers.
Conclusions
If you’re looking to calculate retention for your team, all you need are start and end dates by employee and a little code. It’s also possible to check your suspicions about the cause of attrition if that’s represented in the data.
See also
- Hands-on Survival Analysis with Python (page no longer available)
- Applying Survival Analysis to Reduce Employee Turnover: A Practical Case
- Handbook of Regression Modeling in People Analytics: Ch 9 Survival Analysis for Modeling Singular Events Over Time
- intelliHR explanation of survival analysis for retention – this has some great charts
- PySurvival tutorial on employee retention
Follow-up: How would you handle involuntary exits (layoffs and firings)?
If I’d had to deal with involuntary exits, I would’ve removed them from the population and analyzed them separately.
In the case of voluntary exits, you can use the math to help guide hiring to maintain a stable team size if needed, or to identify groups of people that need more support from management.
In the case of firing, it’s usually a mistake in the hiring pipeline to address.
It’s rarely the case that the underlying problem is the same between those two types of attrition. With that said, I wouldn’t be surprised if there were some employers that had similar underlying causes of voluntary and involuntary exits – and for those employers I’d want to keep them in the same analysis.